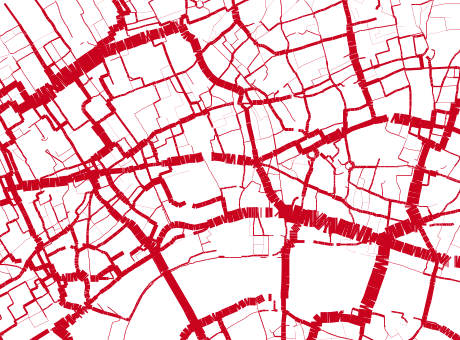
Andy and myself have done a paper for the Autumn 2014 issue of the Urban Design Journal that explores the range of visual analytics by which we mean visualisations that have an analytical meaning – 3D, maps, graphics, flows and dashboards. You can get the paper by clicking here or on the image above.