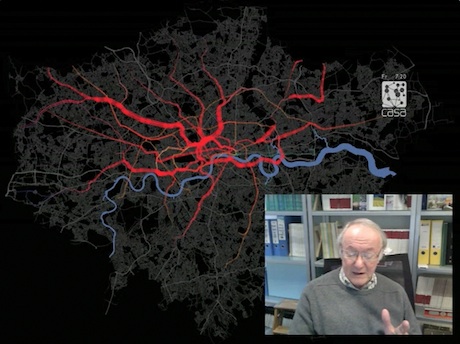
For the online course TechniCity, I have made a little video of Big Data and our Oyster Card project using data from the subway system courtesy of Transport for London, and courtesy of our researcher Dr. Jon Reades. The video above shows you what we are doing and I leave it for you to play it and decide whether you think this kind of data is helpful to understanding and planning cities. My colleague Oliver O’Brien also posted a video today on the ebb and flow of subway traffic using the same source of data and if you want to look at a more professional film of this, then have a look at the one made by UCL Engineering. I also refer to CASA’s Citydashboard in the above video and you can see this by clicking here.
Big Data and the Oyster Project
This entry was posted in Big Data, Connectivity, Flows, Information, Networks, Smart Cities. Bookmark the permalink.

