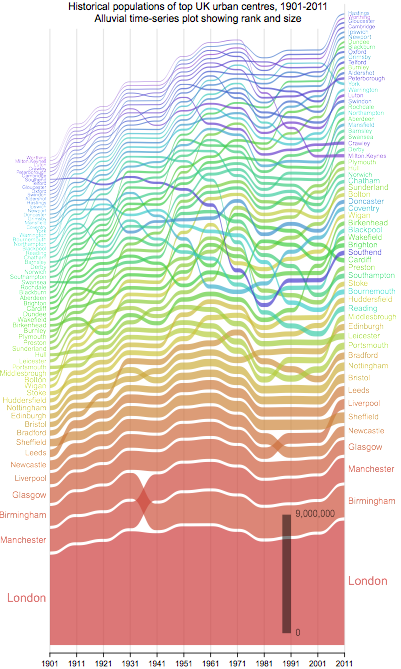
Robin Edwards and myself have improved our visualisation of city size and rank over time and this is now published as a featured graphic in Environment and Planning A in their forthcoming material. It is quite hard to represent three variables in a two-dimensional plot but here Robin and myself use an alluvial diagram similar to a Sankey-type diagram to achieve this which we think encapsulates rather well the way in which cities change not only their rank but also their size over time. Rank and time are unidimensional, integer quantities in our representation while size is continuous volumetric and the graphic we have used captures this rather nicely. I have posted bits of this before but if you click on this link you will get the forthcoming graphic which is in fact free currently at the journal web site. Have a look at our two previous posts to full in all the detail about this. Enjoy